- 您现在的位置:买卖IC网 > Sheet目录1213 > EVAL-220VAC-UKZ (Analog Devices Inc)TRANSF FOR BOARD 220VAC UK
�� �
�
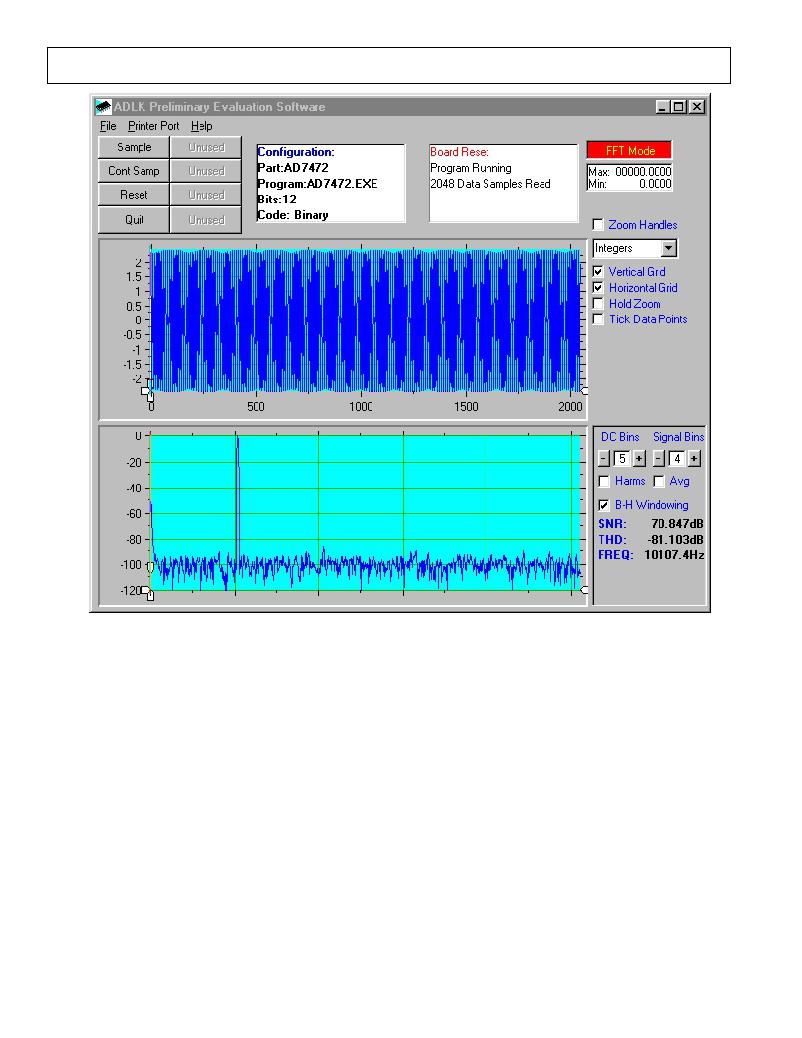
�Evaluation� Board� Controller�
�Figure� 1.� Evaluation� Board� Controller� Main� Screen�
�SOFTWARE� DESCRIPTION�
�The� software� which� controls� the� Evaluation� Board� Con-�
�troller� and� hence� the� evaluation� board� has� three� main�
�screens.� The� screen� shown� in� Figure� 1� shows� the� screen�
�which� appears� when� the� software� is� run.� The� main� func-�
�tion� of� this� screen� is� to� allow� the� user� to� read� a� predeter-�
�mined� number� of� samples� from� the� evaluation� board� and�
�display� them� in� both� the� time� and� frequency� domain.� The�
�screen� can� be� divided� into� 3� sections.� The� upper� third� of�
�the� screen� contains� the� control� buttons,� the� menu� bar� and�
�various� status� windows.� The� control� buttons� allow� the� user�
�to� enter� the� setup� menu,� take� samples� and� get� information�
�about� the� software.� The� menu� bar� allows� the� user� to� select�
�which� printer� port� is� to� be� used� to� control� the� Evaluation�
�Board� Controller,� load� and� save� data� etc.� The� status� win-�
�dows� indicate� the� setup� of� the� evaluation� board/device,�
�number� of� samples� taken� and� any� information/error� mes-�
�sages� that� are� generated.�
�The� middle� third� of� the� screen� is� a� Digital� Storage� Os-�
�cilloscope� (DSO).� When� samples� are� uploaded� from� the�
�Evaluation� Board� Controller� they� are� displayed� here.� The�
�samples� can� be� displayed� either� as� integer� values� or� as�
�voltages� (determined� by� the� input� range� of� the� device� in�
�question).� Once� samples� have� been� displayed� clicking� at�
�any� point� in� the� graph� will� display� the� sample� number� and�
�value� of� the� point� directly� beneath� the� cursor.� Along� the�
�axis� of� the� graph� are� the� "zoom� handles".� These� allow� the�
�user� to� zoom� in� and� out� to� get� a� closer� look� at� a� particular�
�sample� if� required.� When� another� set� of� samples� is� taken�
�the� graph� will� attempt� to� display� all� values� collected� unless�
�the� Hold� Zoom� check� box� is� ticked.� In� this� case� the� graph�
�will� keep� the� same� axis� settings� as� for� the� previous� set� of�
�data� samples.� Additional� check� boxes� are� provided� to� give�
�the� user� control� over� the� vertical� and� horizontal� grids� and�
�data� points.�
�The� lower� third� of� the� screen� will� show� either� a� Fast�
�Fourier� Transform� (FFT)� of� the� data� or� a� Histogram�
�which� shows� the� number� of� occurrances� of� each� particular�
�code� read� back.� The� FFT� (the� default� option)� is� typically�
�used� when� the� user� is� concerned� with� examining� an� ADC's�
�performance� in� the� frequency� domain� while� the� Histogram�
�will� give� an� indication� of� the� ADC's� performance� to� DC�
�signals.� The� option� displayed� can� be� toggled� by� clicking�
�on� the� FFT� Mode/Histogram� Mode� button� in� the� top�
�right� of� the� screen.� Figure� 2� shows� how� the� main� screen�
�looks� when� the� Histogram� Option� is� selected.�
�–4–�
�REV.� A�
�发布紧急采购,3分钟左右您将得到回复。
相关PDF资料
EVAL-AD1939AZ
BOARD EVAL FOR AD1939
EVAL-AD5172SDZ
BOARD EVAL FOR AD5172
EVAL-AD5252SDZ
BOARD EVAL FOR AD5252
EVAL-AD5254SDZ
BOARD EVAL FOR AD5254
EVAL-AD5932EBZ
BOARD EVAL FOR AD5932
EVAL-AD74111EBZ
BOARD EVAL FOR AD74111
EVAL-AD7741/42EBZ
BOARD EVAL FOR AD7741/7742
EVAL-AD8003-3CPEZ
BOARD EVALUATION AD8003-3CPEZ
相关代理商/技术参数
EVAL2293Q
功能描述:电源管理IC开发工具 L2293Q 4-Ch Driver Evaluation Board RoHS:否 制造商:Maxim Integrated 产品:Evaluation Kits 类型:Battery Management 工具用于评估:MAX17710GB 输入电压: 输出电压:1.8 V
EVAL232R
功能描述:界面开发工具 USB to RS232 Dev Module for FT232R IC RoHS:否 制造商:Bourns 产品:Evaluation Boards 类型:RS-485 工具用于评估:ADM3485E 接口类型:RS-485 工作电源电压:3.3 V
EVAL2X8-ISO1H801G
制造商:Infineon Technologies AG 功能描述:
EVAL2X8-ISO1H802G
制造商:Infineon Technologies AG 功能描述:
EVAL-315-DS
功能描述:射频开发工具 DS Series Basic Eval Kit 315MHz
RoHS:否 制造商:Taiyo Yuden 产品:Wireless Modules 类型:Wireless Audio 工具用于评估:WYSAAVDX7 频率: 工作电源电压:3.4 V to 5.5 V
EVAL-315-HHCP
功能描述:射频开发工具 Compact HandHeld Eval Sys 315MHz
RoHS:否 制造商:Taiyo Yuden 产品:Wireless Modules 类型:Wireless Audio 工具用于评估:WYSAAVDX7 频率: 工作电源电压:3.4 V to 5.5 V
EVAL-315-HHLR
功能描述:射频开发工具 Long Range HandHeld Eval Sys 315MHz
RoHS:否 制造商:Taiyo Yuden 产品:Wireless Modules 类型:Wireless Audio 工具用于评估:WYSAAVDX7 频率: 工作电源电压:3.4 V to 5.5 V
EVAL-315-HHTX
功能描述:射频开发工具 HandHeld Eval System 315MHz, HHTX Series
RoHS:否 制造商:Taiyo Yuden 产品:Wireless Modules 类型:Wireless Audio 工具用于评估:WYSAAVDX7 频率: 工作电源电压:3.4 V to 5.5 V